
Read your dashboard
What the big card on Overview means, and what the list of top categories is telling you.
The Overview tab is the first one in the bar, and it answers one question: what does all of this cost?
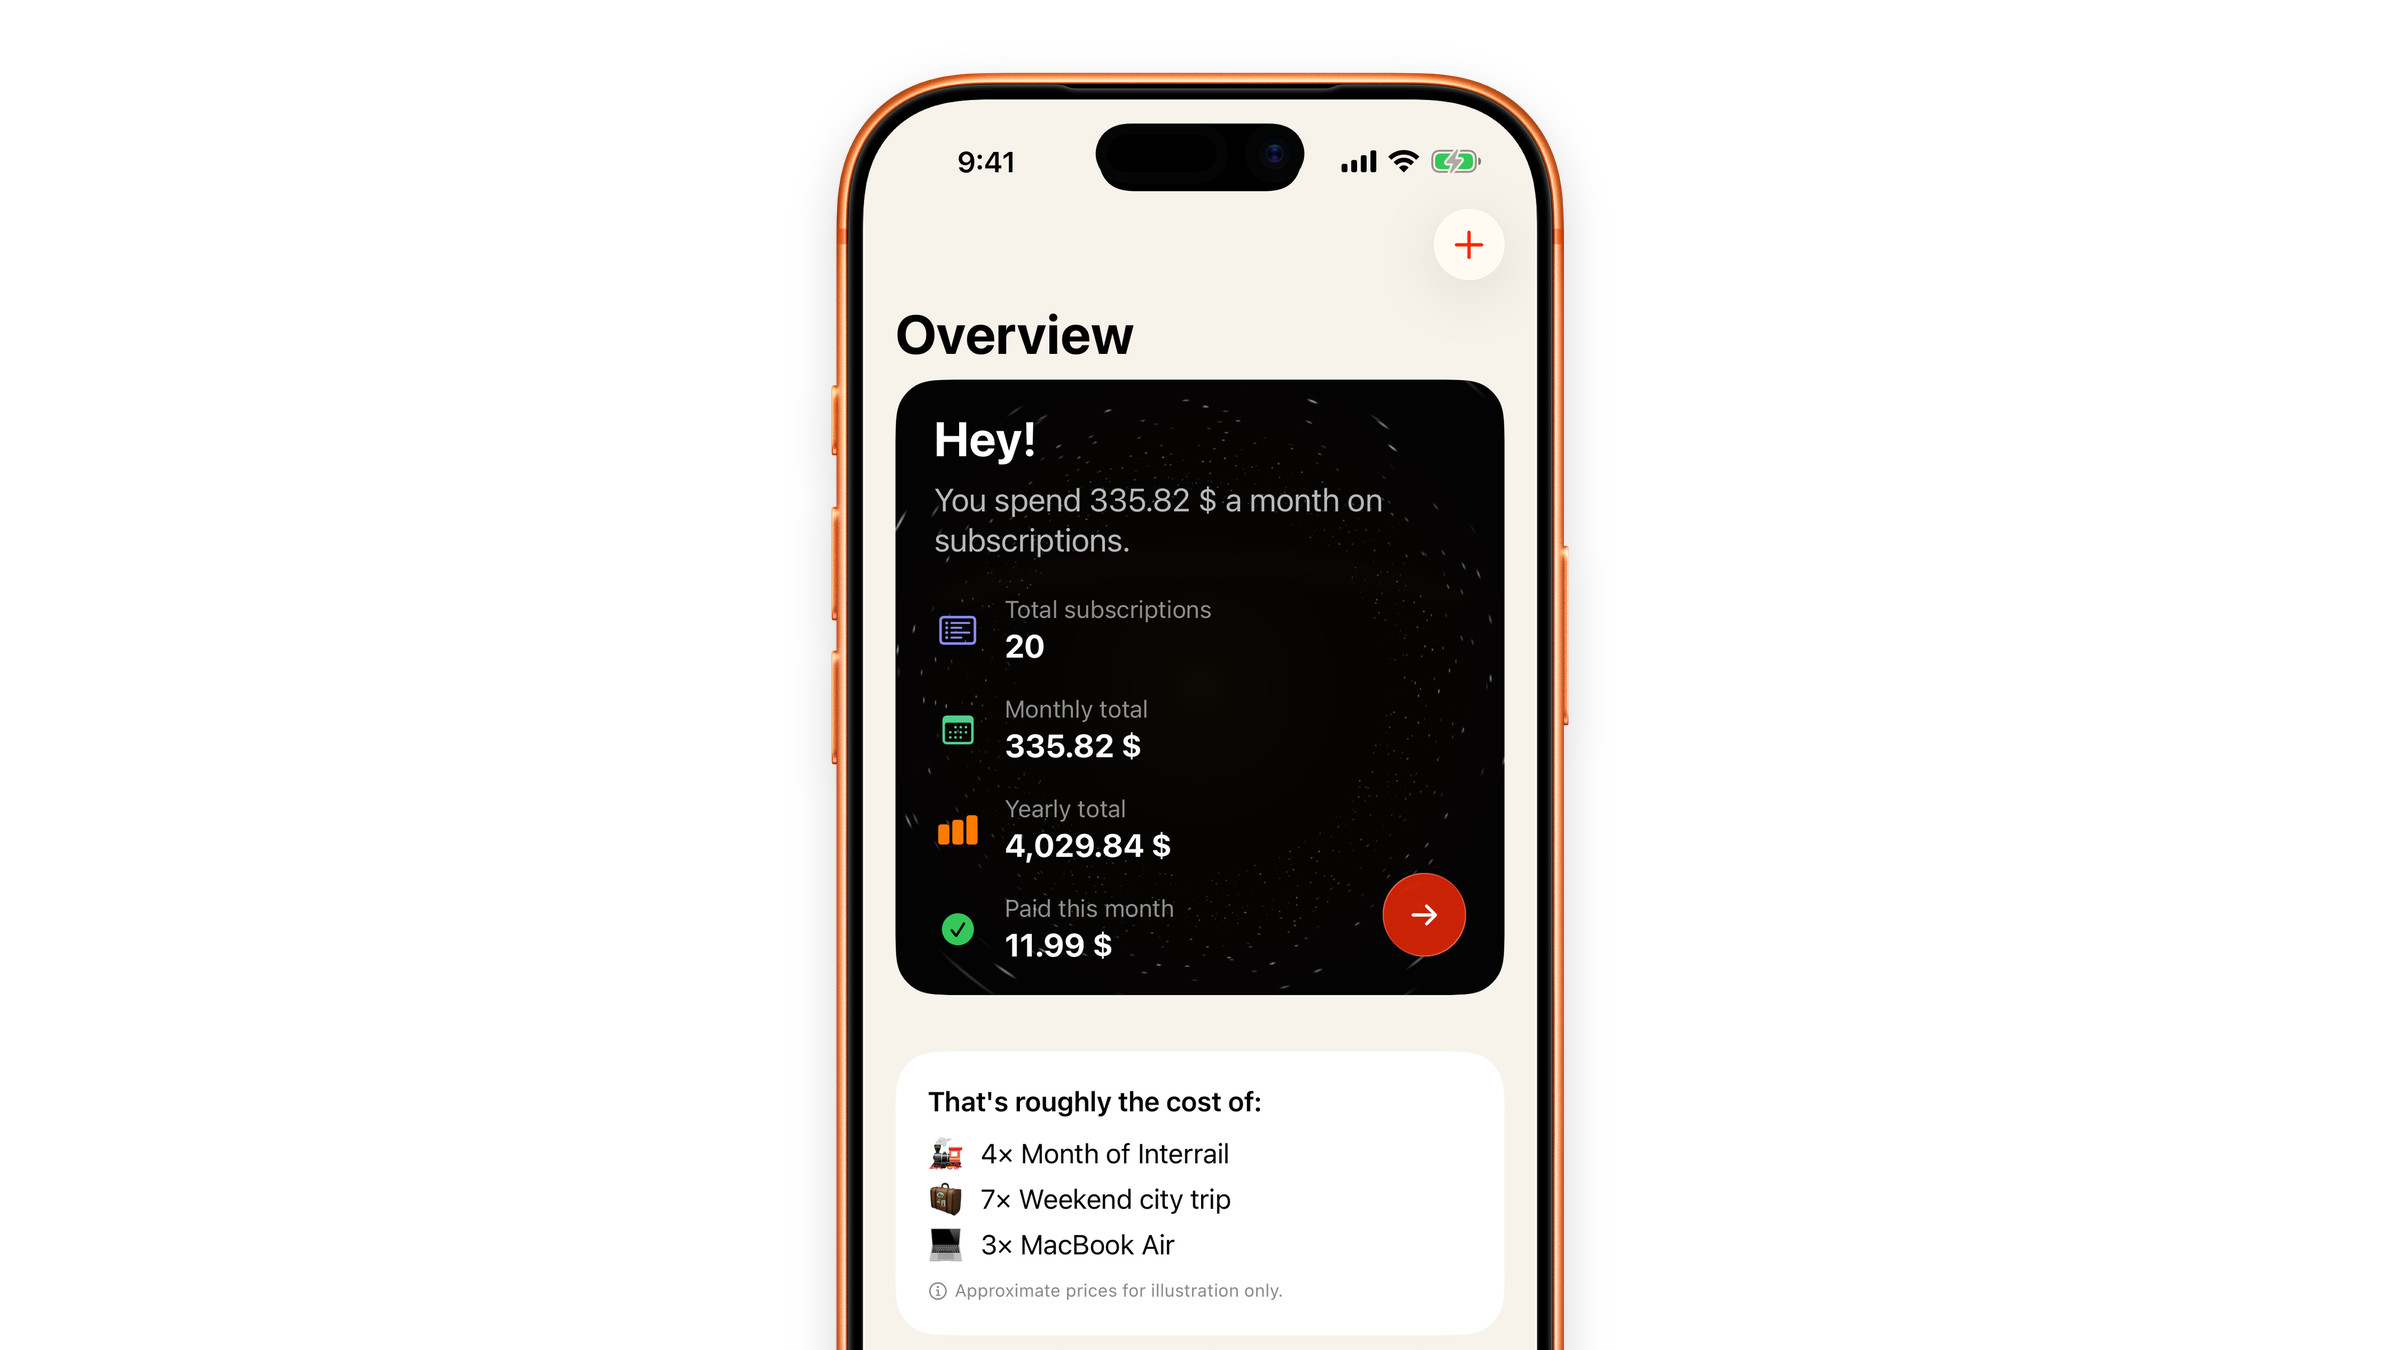
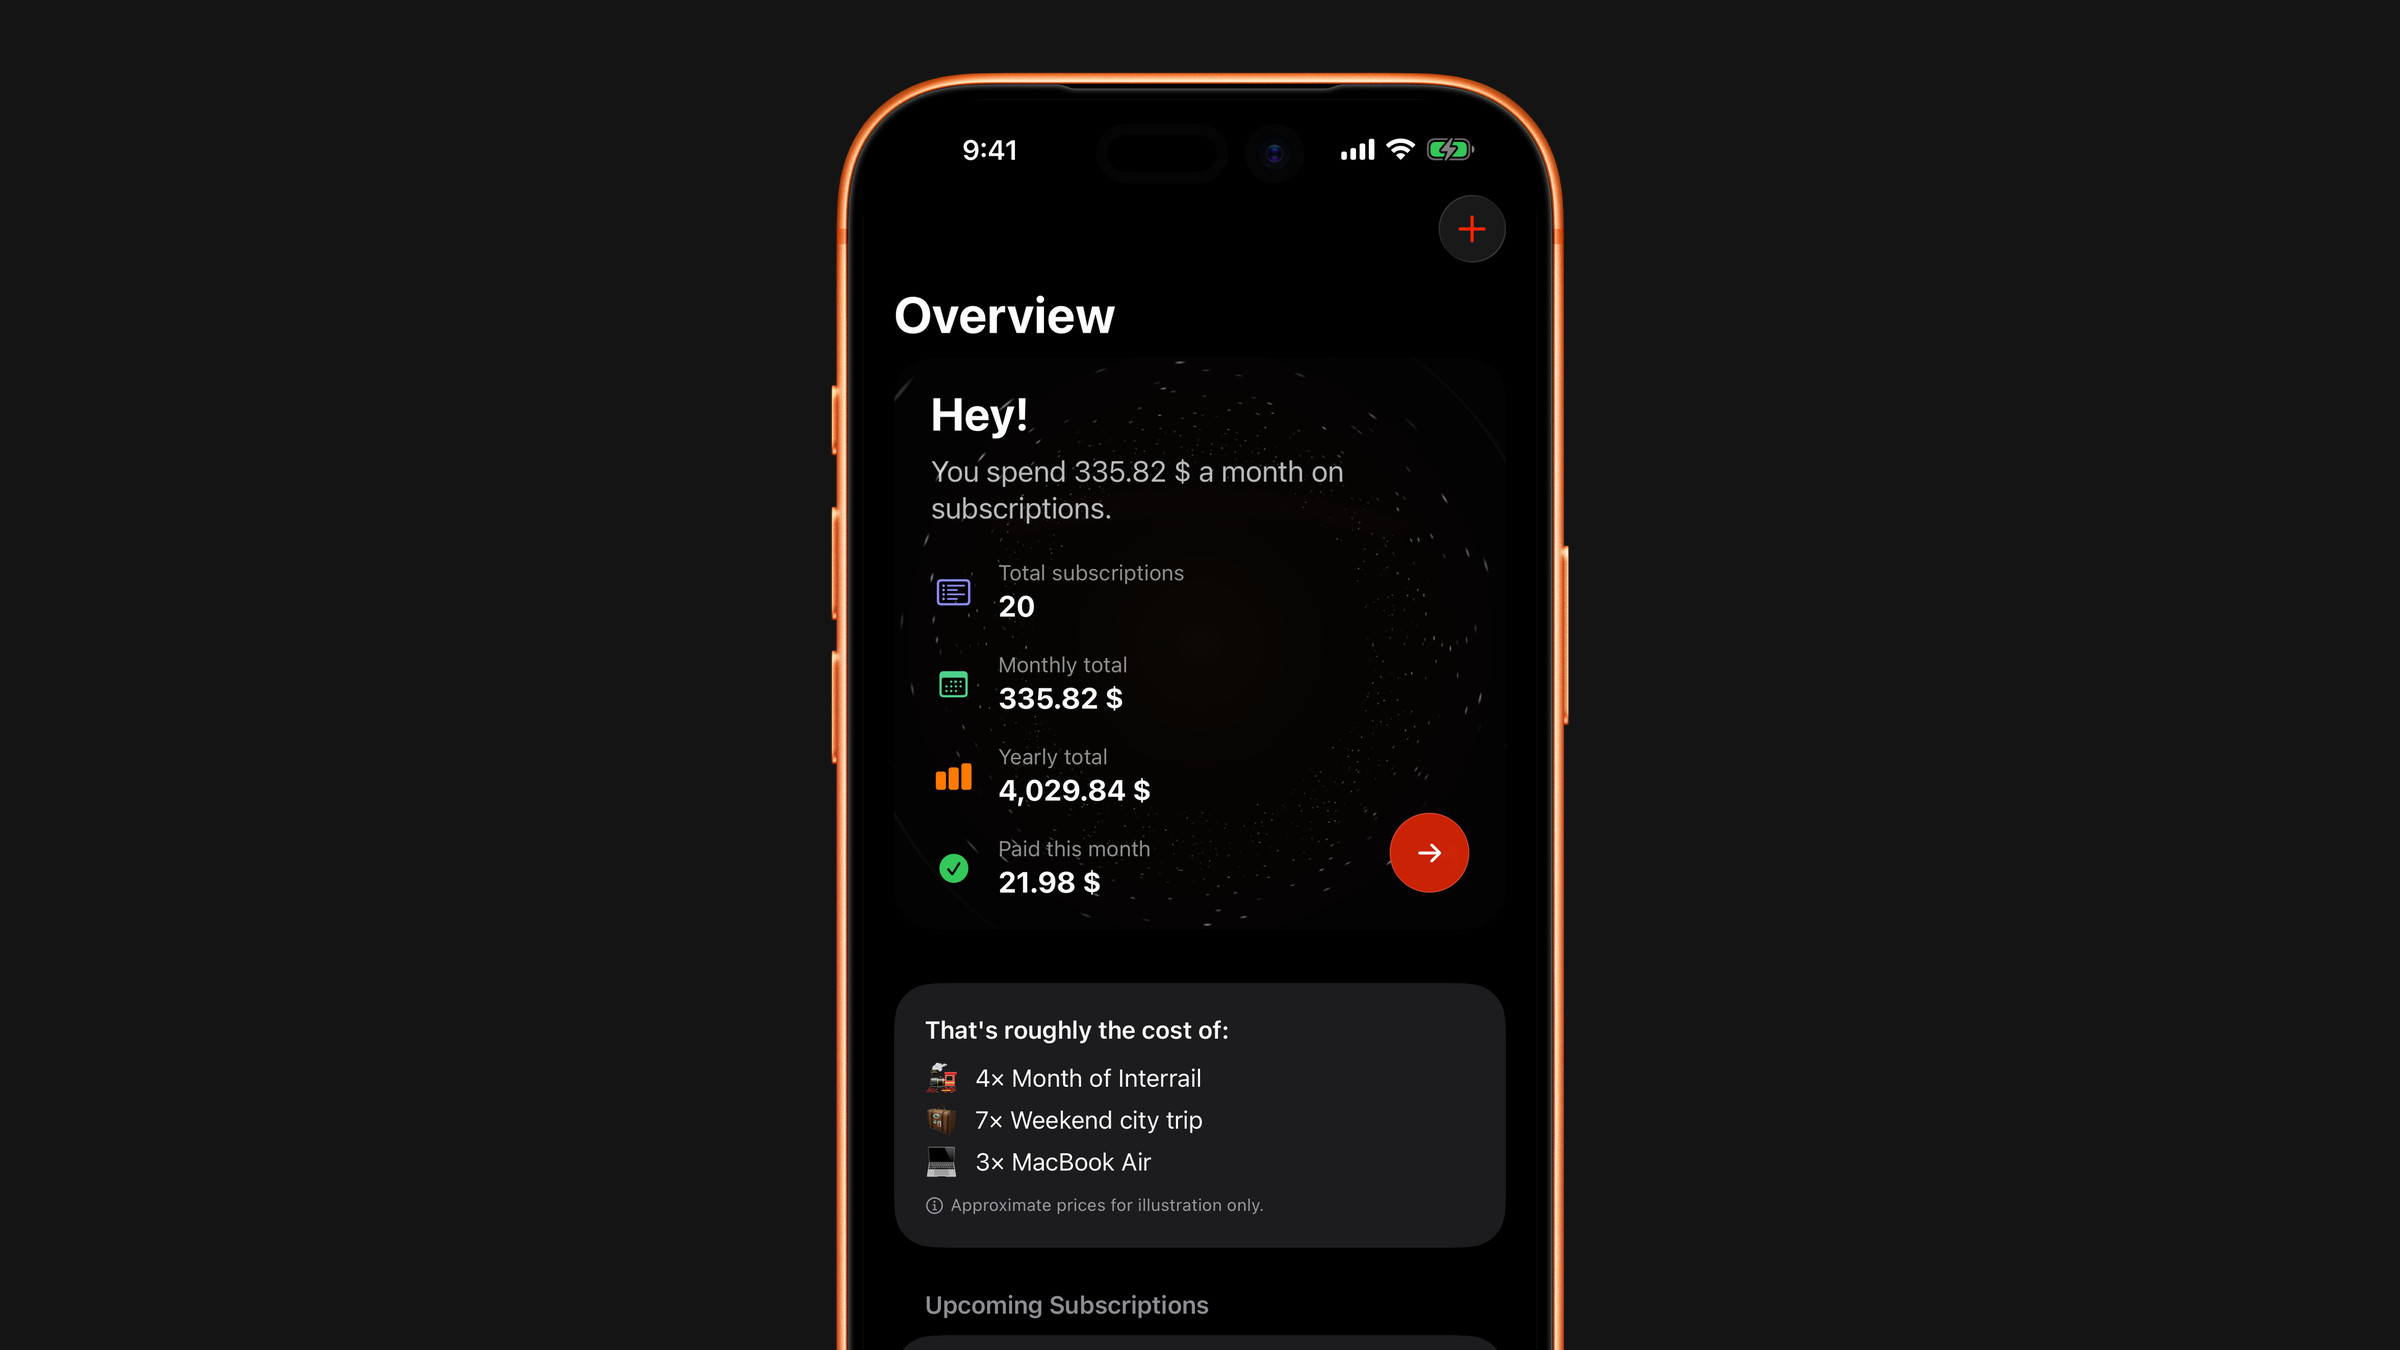
The card at the top
A dark card greets you with one sentence, "You spend X a month on subscriptions", and four figures under it, all in your display currency:
- Total subscriptions: how many of them are active.
- Monthly total: what they cost in a month.
- Yearly total: what they cost in a year. This is the number that changes minds.
- Paid this month: what has already gone this month.
Tap the card, or the orange arrow in its corner, to open the Subscriptions tab.
Anything billed in another currency is converted at current rates before it is added in. A subscription you share with other people counts only for your share, and a one-time payment is left out of the monthly and yearly figures, because it is a single charge rather than a rate.
Paid this month is not an average: it adds up the charges of this month that have already happened or that you have ticked off as paid. Ticking a charge off raises it by that amount. If your money runs from payday to payday rather than from the 1st, set Month starts on in Settings and the month this figure covers starts on that day instead.
The breakdown per day and per week lives on each subscription's own page: see Cost per day, month and year.
Below the card
- That's roughly the cost of: your yearly total turned into everyday things, for example a month of Interrail or a weekend city trip. The prices behind it are approximate and only there for perspective. Tap the card to see how it works.
- Upcoming Subscriptions: the charges due in the next 30 days, nearest first, up to five. Each row shows the date, the price and how many days are left, which turns red when a week or less remains. Tap a row to open the subscription, where you can edit or delete it.
- Top categories: your monthly cost split by category, as a list with a bar, an amount and a share for each. It shows five rows, and Show all opens the rest. It is there to show concentration rather than detail: most people find that two categories account for most of the money, and they are rarely the two they would have guessed.
- Daily Affirmation: a calm thought about money, new every day. It starts closed; tap Reveal to open it, and from there you can share it or send it to your Lock Screen. See Put the affirmation on your Lock Screen.
- A card that opens the Subscrr Journal, and at the very bottom a line with an exchange rate and how long ago the rates were updated.
What is not in it
The dashboard counts subscriptions only. Habits you entered in the calculator and receipts you scanned are counted separately, because they answer a different question. See Read the spending statistics.
A subscription you switched on Exclude from totals stays in the list, but the monthly and yearly figures, the equivalents and the category list do not count it.
Did this answer your question?