
Read the spending statistics
A donut of where the money goes, your biggest expenses, and how one-off purchases are counted.
Once you have a few expenses on the Spending tab, entered by hand or added from scanned receipts, statistics start to answer the question that single entries cannot: what do I actually spend on?
To open them, tap the summary card at the top of the Spending tab, the one with your monthly amount and the donut.
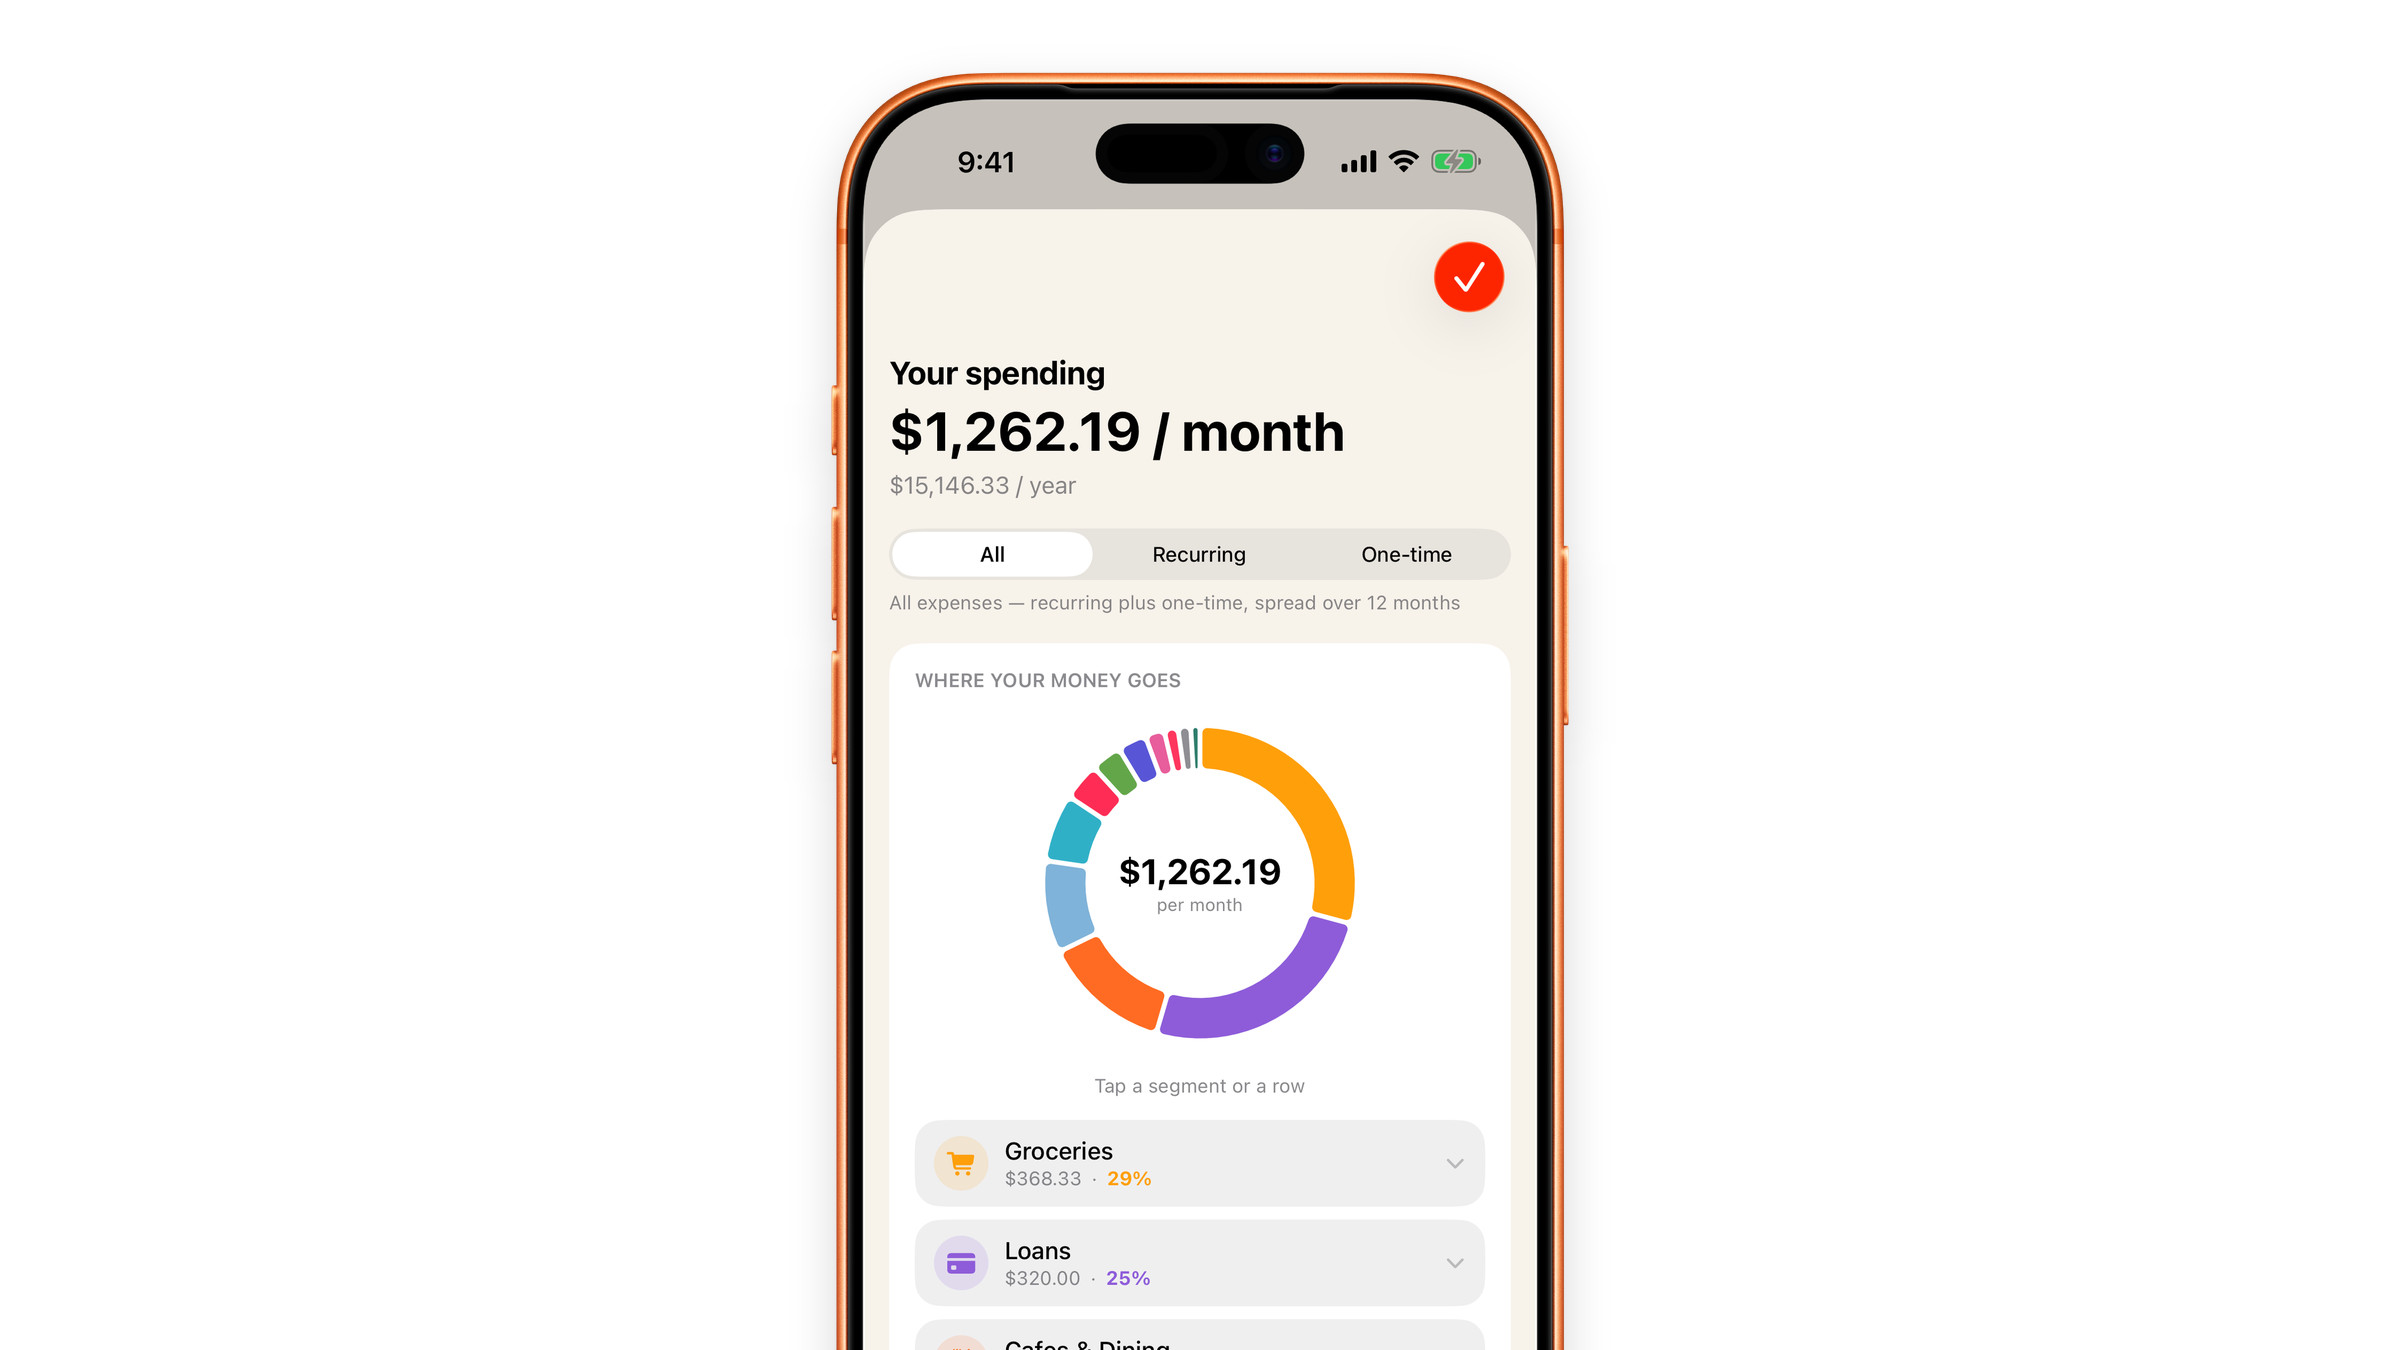
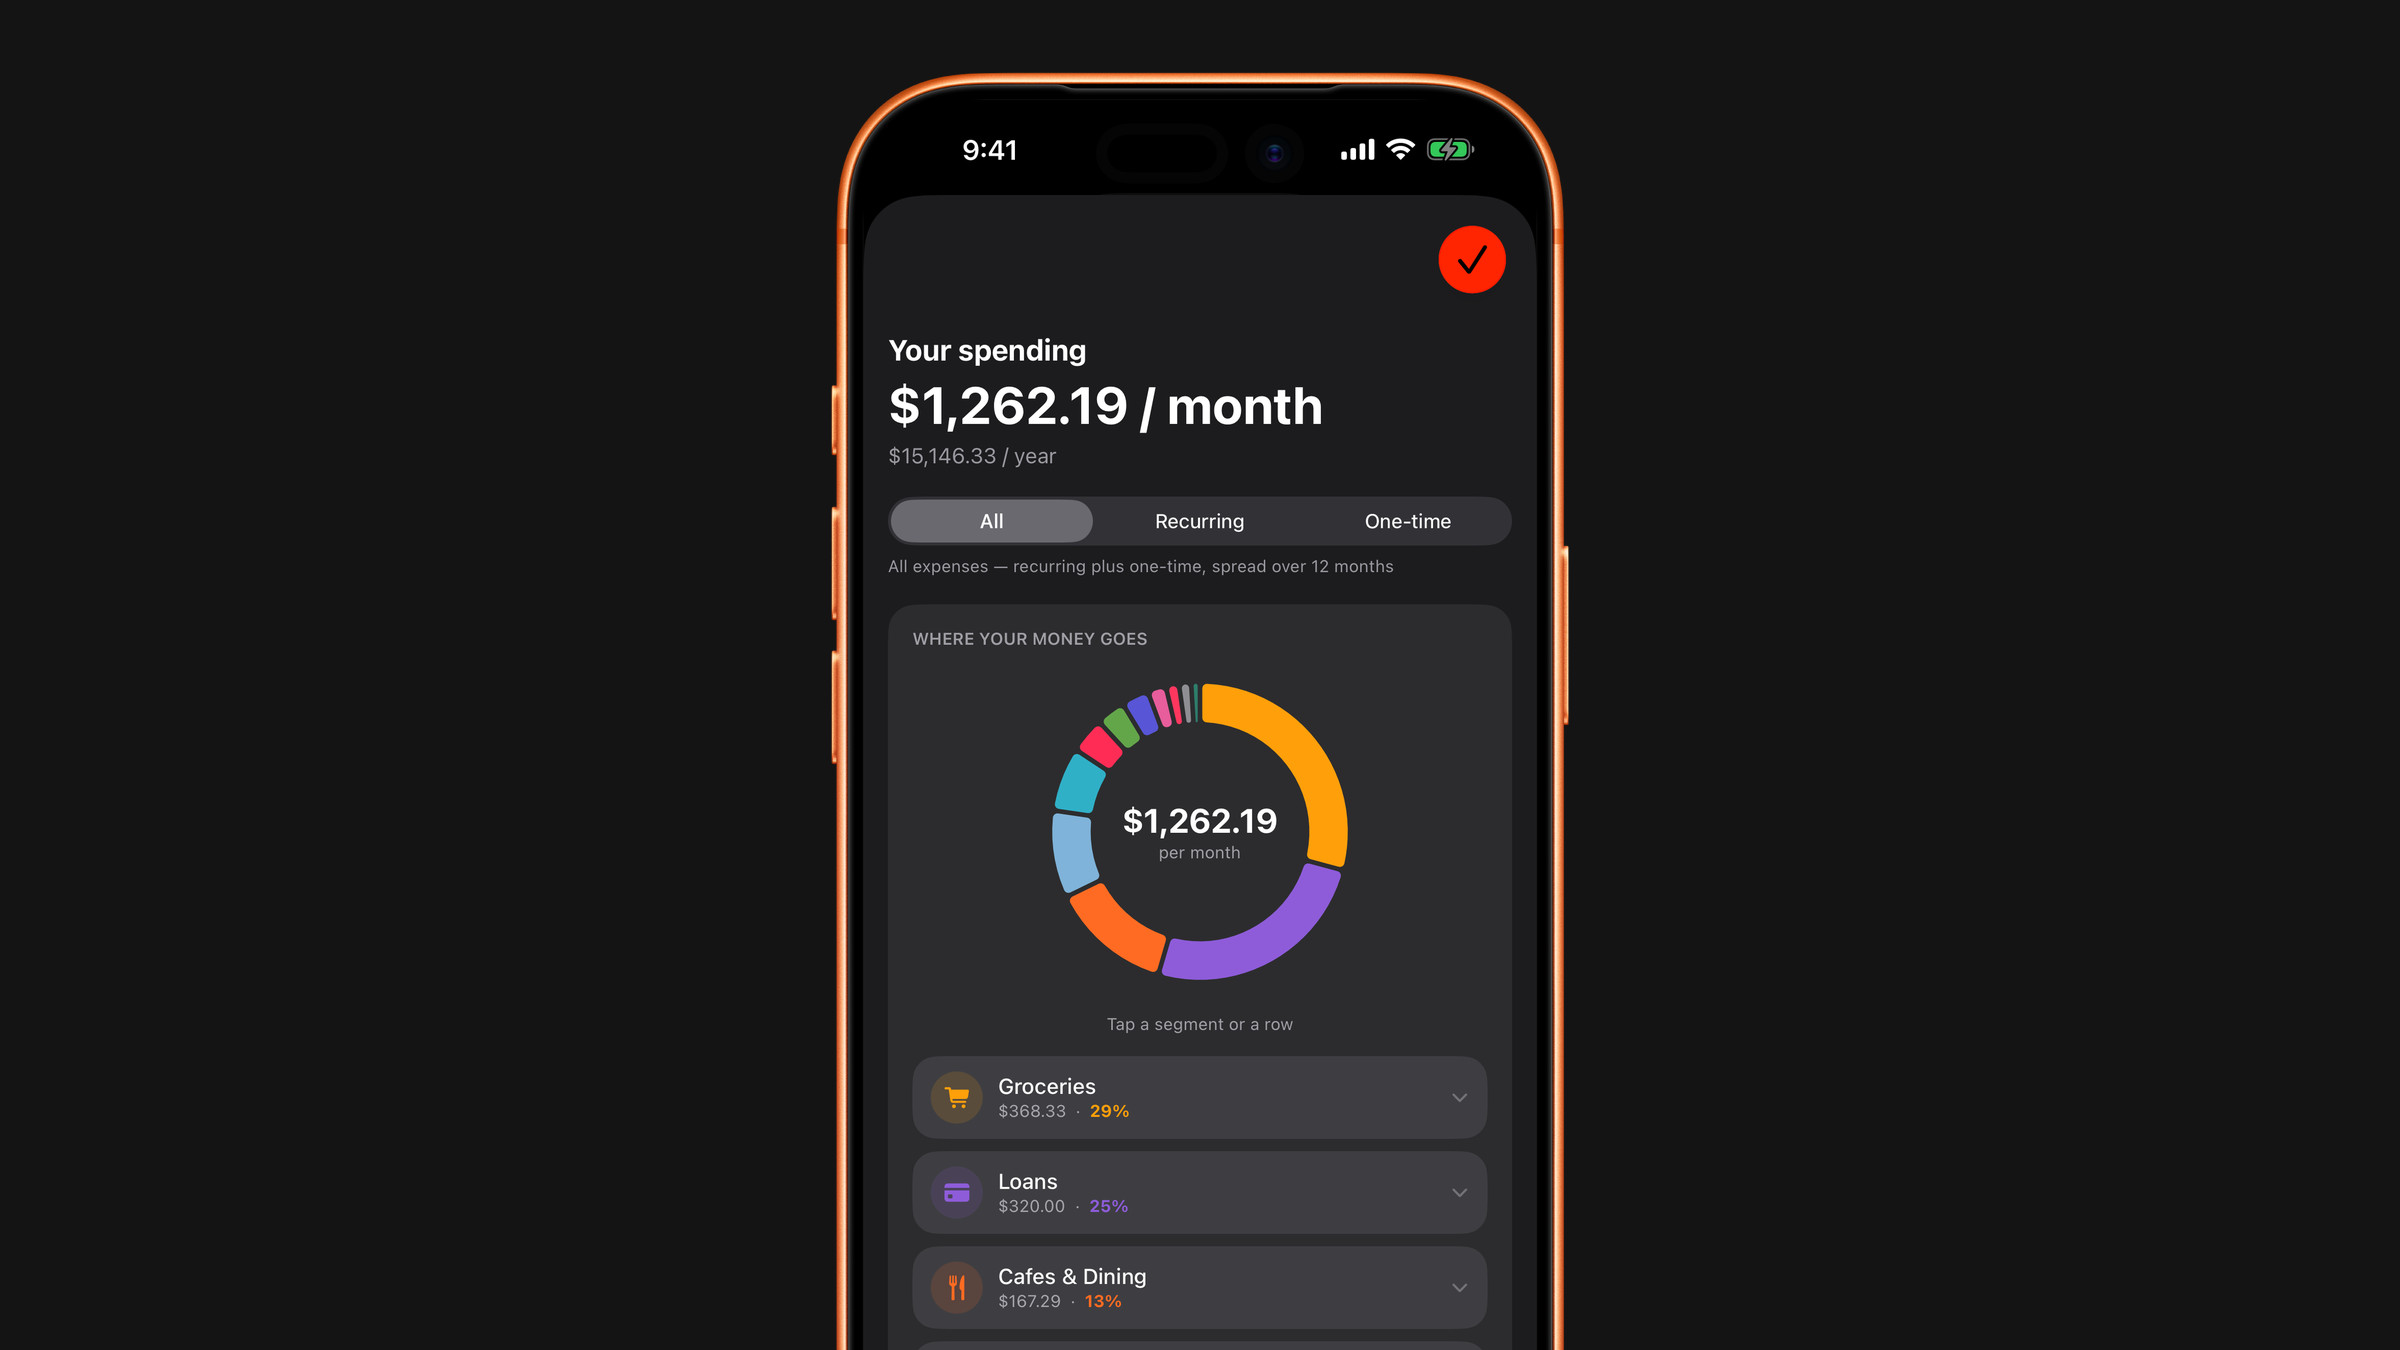
What is on the screen
- Your spending: the total per month and per year.
- All, Recurring, One-time: the switch starts on the slice you had picked on the tab, and the line under it says exactly what is counted.
- Where your money goes: a donut split by category. Tap a segment or a row to open the expenses inside it, each with its monthly figure. This is the part that changes behaviour, because the categories that dominate are usually not the ones people expect.
- Your biggest expense: shown when one expense makes up at least a tenth of everything.
- Biggest expenses: the top five, with their share and a bar to compare them by eye.
How one-off purchases are counted
A single large purchase should not pass for a monthly habit, so on this screen every figure is a monthly one: regular expenses at their own monthly cost, one-off purchases, scanned receipts included, spread over twelve months. Recurring leaves the one-offs out, One-time shows only them. On the tab itself, One-time lists the purchases at their full amounts.
That is also why a category on the tab can read "85 per week" while the statistics say "368 / month": the tab shows the price of an expense as you entered it, the statistics put everything on the same monthly footing.
Why it does not match the dashboard
The dashboard counts subscriptions only. Statistics count the expenses you entered or added from a scan, and nothing else. A scan that you did not add to your expenses is not in them, and neither is anything you did not enter: they can only count what you gave them.
Did this answer your question?